Click here for the presentation file
This capstone project was done after finishing the Junior Data Scientist program with CADS to showcase our skills that we have gained as well as to show completing projects within a team.
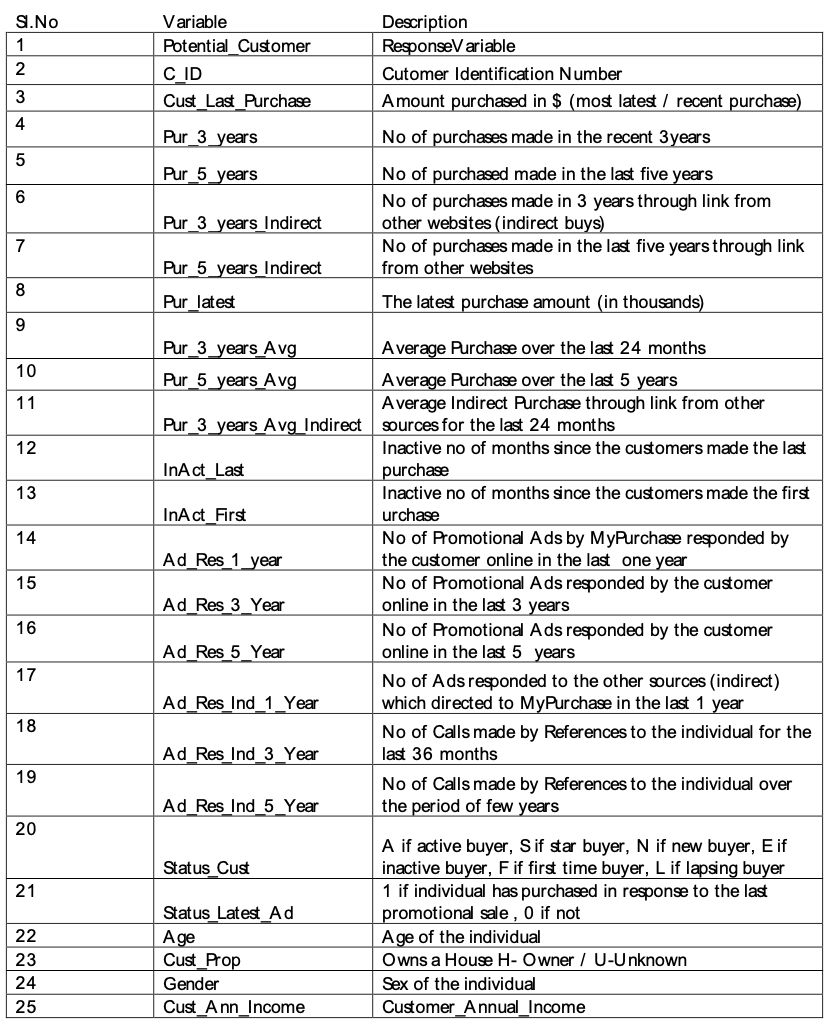
You have been provided with information about the customers' historical purchase as the amount of money spent, Number of inactive months and so on. Two columns Potential_Customer and Cust_Last_Purchase represent the customers' respond to the latest advertisement. The column Potential_Customer represents if the customer purchased any product, and the column Cust_Last_Purchase represents the amount of this purchase and it is Nan if there has been no purchase.
1. Design a predictive model to determine the potential customers who will purchase if you send the advertisement . The target variable is Potential_Customer.
**Attention:** Because the column `Cust_Last_Purchase` relates to the target variable `Potential_Customer`, you need to exclude it from your model.
2. Calculate the value and the revenue of your model. Fit your model on train set. Assume amonge the customers on your test set we only send advertisement to those your model predicted as Class1 and we ignore the rest. From the data you can calculate the average Cust_Last_Purchase for those who are in the train set and had the last purchase (Cust_Last_Purchase>0) . Assume sending advertisement to each customer costs 5$ and the average purchase you calculated on the train set remains the same for the test set. Calculate the value of your models to choose the best model.
- cost = advertisement_cost * number of the predicted positive
- lost = average_purchase * number of the predicted negative but they have been positive
- gain = average_purchase * number of the predicted positive and they have been positive
- value = gain - lost - cost
- revenue = gain - cost
3. Compare your best model's revenue with the revenue of the default solution which is sending advertisement to all the customers in X_test. Which solution would you choose?
- cost = advertisement_cost * size of the test set
- gain = sum(Cust_Last_Purchase) on test set
- revenue = gain - cost
4. Assume the next time you want to target a group of 30,000 customers simillar to this group. And assume the purchase rate is $10%$ which means 10 out of 100 people who receive the advertisement will purchase the product. Also assume your model will have the same Precision and Recall for Class1 . Will you send the advertisement to everyone, or you use one of the models you have already created?
- calculate your model's revenue on this set of 30,000 customers based on the above assumptions
- calculate the revenue of the default model: send advertisement to everyone
     - cost = advertisement_cost * size of the test set
     - gain = average_purchase * purchase_rate
     - revenue = gain - cost
Hint: To calculate the revenue of a model for this new set of customers with different purchase rate we need to calculate the new confusion matrix given Precision and Recall for Class1 are fixed.
Perform the following:
The output expected at the end of this capstone is:
One zip file per group is to be uploaded on GDrive by the time that will be given to you by the trainer, including the jupyter notebook(s) and the powerpoint presentation indicating the names of all group members.
Note(s):
# Importing relevant packages
import pandas as pd
import numpy as np
import matplotlib.pyplot as plt
import seaborn as sns

from sklearn.linear_model import LogisticRegression
from sklearn.ensemble import RandomForestClassifier, GradientBoostingClassifier
from sklearn.neighbors import KNeighborsClassifier
from sklearn.tree import DecisionTreeClassifier
from sklearn.svm import SVC
from sklearn.model_selection import train_test_split
from sklearn.metrics import confusion_matrix
from sklearn.preprocessing import StandardScaler
from sklearn.model_selection import GridSearchCV
from sklearn.metrics import recall_score, precision_score, f1_score
from sklearn.model_selection import cross_val_score
from sklearn.model_selection import cross_val_predict
from sklearn.metrics import classification_report
from sklearn.neural_network import MLPClassifier
from sklearn.model_selection import cross_val_score, GridSearchCV
from sklearn.metrics import accuracy_score, roc_auc_score, f1_score
from sklearn.metrics import accuracy_score
import warnings
warnings.filterwarnings("ignore")
# Load the data into data dataframe
data = pd.read_csv('../data.csv')
# View first 5 rows of dataframe
data.head()
| Potential_Customer | C_ID | Cust_Last_Purchase | Pur_3_years | Pur_5_years | Pur_3_years_Indirect | Pur_5_years_Indirect | Pur_latest | Pur_3_years_Avg | Pur_5_years_Avg | ... | Ad_Res_5_Year | Ad_Res_Ind_1_Year | Ad_Res_Ind_3_Year | Ad_Res_Ind_5_Year | Status_Cust | Status_Latest_Ad | Age | Gender | Cust_Prop | Cust_Ann_Income | |
|---|---|---|---|---|---|---|---|---|---|---|---|---|---|---|---|---|---|---|---|---|---|
| 0 | 1 | 9946 | $5.00 | 2 | 17 | 2 | 4 | $0.00 | $7.50 | $7.76 | ... | 73 | 3 | 12 | 16 | A | 0 | 71.0 | F | H | $65,957.00 |
| 1 | 1 | 87939 | $30.00 | 1 | 7 | 0 | 3 | $25.00 | $25.00 | $13.00 | ... | 55 | 6 | 6 | 22 | A | 1 | 7.0 | M | U | $0.00 |
| 2 | 0 | 88003 | NaN | 5 | 12 | 3 | 5 | $15.00 | $15.00 | $11.25 | ... | 53 | 6 | 17 | 22 | S | 1 | 79.0 | F | U | $0.00 |
| 3 | 1 | 188721 | $20.00 | 1 | 11 | 0 | 3 | $20.00 | $20.00 | $12.45 | ... | 71 | 8 | 8 | 33 | A | 0 | 73.0 | F | U | $76,293.00 |
| 4 | 1 | 88056 | $5.00 | 3 | 15 | 2 | 7 | $3.00 | $4.33 | $3.80 | ... | 63 | 6 | 12 | 24 | S | 1 | 68.0 | F | H | $113,663.00 |
5 rows × 25 columns
# View your data
data.describe().T
| count | mean | std | min | 25% | 50% | 75% | max | |
|---|---|---|---|---|---|---|---|---|
| Potential_Customer | 4469.0 | 0.480868 | 0.499690 | 0.0 | 0.0 | 0.0 | 1.0 | 1.0 |
| C_ID | 4469.0 | 73837.719848 | 36156.968605 | 12.0 | 52713.0 | 75790.0 | 93705.0 | 191672.0 |
| Pur_3_years | 4469.0 | 3.297158 | 2.207326 | 0.0 | 2.0 | 3.0 | 4.0 | 15.0 |
| Pur_5_years | 4469.0 | 11.006042 | 9.459082 | 1.0 | 4.0 | 9.0 | 15.0 | 91.0 |
| Pur_3_years_Indirect | 4469.0 | 1.897516 | 1.629178 | 0.0 | 1.0 | 2.0 | 3.0 | 9.0 |
| Pur_5_years_Indirect | 4469.0 | 5.867756 | 4.939174 | 0.0 | 2.0 | 4.0 | 9.0 | 41.0 |
| InAct_Last | 4469.0 | 17.923697 | 4.130671 | 4.0 | 16.0 | 18.0 | 20.0 | 27.0 |
| InAct_First | 4469.0 | 73.605952 | 38.094688 | 15.0 | 40.0 | 74.0 | 111.0 | 260.0 |
| Ad_Res_1_year | 4469.0 | 13.070038 | 4.991064 | 3.0 | 11.0 | 12.0 | 13.0 | 49.0 |
| Ad_Res_3_Year | 4469.0 | 29.631237 | 7.787209 | 5.0 | 26.0 | 31.0 | 34.0 | 71.0 |
| Ad_Res_5_Year | 4469.0 | 49.683822 | 23.056042 | 7.0 | 31.0 | 51.0 | 66.0 | 157.0 |
| Ad_Res_Ind_1_Year | 4469.0 | 5.406355 | 1.361155 | 1.0 | 5.0 | 6.0 | 6.0 | 17.0 |
| Ad_Res_Ind_3_Year | 4469.0 | 12.045872 | 4.586081 | 2.0 | 7.0 | 13.0 | 16.0 | 28.0 |
| Ad_Res_Ind_5_Year | 4469.0 | 19.496979 | 8.580510 | 3.0 | 13.0 | 20.0 | 27.0 | 56.0 |
| Status_Latest_Ad | 4469.0 | 0.562094 | 0.496185 | 0.0 | 0.0 | 1.0 | 1.0 | 1.0 |
| Age | 3510.0 | 59.020228 | 16.902682 | 0.0 | 47.0 | 60.0 | 73.0 | 87.0 |
Checking the existance of missing values, the type of variables, or integrity of data.
print("rows and column =",data.shape)
rows and column = (4469, 25)
data.dtypes
Potential_Customer            int64
C_ID                          int64
Cust_Last_Purchase           object
Pur_3_years                   int64
Pur_5_years                   int64
Pur_3_years_Indirect          int64
Pur_5_years_Indirect          int64
Pur_latest                   object
Pur_3_years_Avg              object
Pur_5_years_Avg              object
Pur_3_years_Avg_Indirect     object
InAct_Last                    int64
InAct_First                   int64
Ad_Res_1_year                 int64
Ad_Res_3_Year                 int64
Ad_Res_5_Year                 int64
Ad_Res_Ind_1_Year             int64
Ad_Res_Ind_3_Year             int64
Ad_Res_Ind_5_Year             int64
Status_Cust                  object
Status_Latest_Ad              int64
Age                         float64
Gender                       object
Cust_Prop                    object
Cust_Ann_Income              object
dtype: object
Cust_Last_Purchase are object while they should be float64? Fix the type of the columns as it should be.¶Attention: Some numerical columns have missing values, Dollar sign, or Comma. You need to fix the issue to be able to convert the column to numerical.
Hint:
The following code can help you to remove an 'OldSign' and replace it with a 'NewSign' or nothing: df.col=df.col.str.replace('OldSign', 'NewSign')
After removing the signs and replace it with correct sign, or nothing you need to:
a- Create a list of the name of the categorical columns and the numerical columns:
CatCols=[Name of the Categorical columns]
NumCols=list(set(data.columns)-set(CatCols))
b- Fix the type of the columns
data[CatCols] = data[CatCols].apply(lambda x: x.astype('category'))
data[NumCols] = data[NumCols].apply(lambda x: x.astype('float64'))
# check type of object in respective columns

data_columns_obj = (["Cust_Last_Purchase", "Pur_latest", "Pur_3_years_Avg",
                     "Pur_5_years_Avg", "Pur_3_years_Avg_Indirect", "Status_Cust",
                     "Gender", "Cust_Prop", "Cust_Ann_Income"])

for x in data_columns_obj:
    print("Column:", x)
    print(data[x])
    print()


# Here we found the object type is $ and comma (,)
Column: Cust_Last_Purchase
0        $5.00
1       $30.00
2           NaN
3       $20.00
4        $5.00
         ...
4464     $5.00
4465     $5.00
4466    $10.00
4467     $5.00
4468        NaN
Name: Cust_Last_Purchase, Length: 4469, dtype: object

Column: Pur_latest
0        $0.00
1       $25.00
2       $15.00
3       $20.00
4        $3.00
         ...
4464     $9.00
4465     $5.00
4466    $10.00
4467     $2.50
4468     $5.00
Name: Pur_latest, Length: 4469, dtype: object

Column: Pur_3_years_Avg
0        $7.50
1       $25.00
2       $15.00
3       $20.00
4        $4.33
         ...
4464     $7.80
4465     $6.25
4466     $8.40
4467     $2.63
4468    $11.67
Name: Pur_3_years_Avg, Length: 4469, dtype: object

Column: Pur_5_years_Avg
0        $7.76
1       $13.00
2       $11.25
3       $12.45
4        $3.80
         ...
4464     $6.21
4465     $5.71
4466     $6.29
4467     $2.32
4468    $11.25
Name: Pur_5_years_Avg, Length: 4469, dtype: object

Column: Pur_3_years_Avg_Indirect
0        $7.50
1           NaN
2       $14.67
3           NaN
4        $4.00
         ...
4464     $7.67
4465     $5.00
4466     $8.00
4467     $2.67
4468    $10.00
Name: Pur_3_years_Avg_Indirect, Length: 4469, dtype: object

Column: Status_Cust
0       A
1       A
2       S
3       A
4       S
       ..
4464    S
4465    A
4466    S
4467    A
4468    A
Name: Status_Cust, Length: 4469, dtype: object

Column: Gender
0       F
1       M
2       F
3       F
4       F
       ..
4464    M
4465    M
4466    F
4467    F
4468    M
Name: Gender, Length: 4469, dtype: object

Column: Cust_Prop
0       H
1       U
2       U
3       U
4       H
       ..
4464    H
4465    U
4466    U
4467    U
4468    H
Name: Cust_Prop, Length: 4469, dtype: object

Column: Cust_Ann_Income
0        $65,957.00
1             $0.00
2             $0.00
3        $76,293.00
4       $113,663.00
            ...
4464     $29,081.00
4465     $29,081.00
4466          $0.00
4467     $45,281.00
4468     $41,165.00
Name: Cust_Ann_Income, Length: 4469, dtype: object
# we need to replace $ and comma (,) with empty string

for x in data_columns_obj:
    data[x] = data[x].str.replace("$", "")
    data[x] = data[x].str.replace(",", "")
data.head()
| Potential_Customer | C_ID | Cust_Last_Purchase | Pur_3_years | Pur_5_years | Pur_3_years_Indirect | Pur_5_years_Indirect | Pur_latest | Pur_3_years_Avg | Pur_5_years_Avg | ... | Ad_Res_5_Year | Ad_Res_Ind_1_Year | Ad_Res_Ind_3_Year | Ad_Res_Ind_5_Year | Status_Cust | Status_Latest_Ad | Age | Gender | Cust_Prop | Cust_Ann_Income | |
|---|---|---|---|---|---|---|---|---|---|---|---|---|---|---|---|---|---|---|---|---|---|
| 0 | 1 | 9946 | 5.00 | 2 | 17 | 2 | 4 | 0.00 | 7.50 | 7.76 | ... | 73 | 3 | 12 | 16 | A | 0 | 71.0 | F | H | 65957.00 |
| 1 | 1 | 87939 | 30.00 | 1 | 7 | 0 | 3 | 25.00 | 25.00 | 13.00 | ... | 55 | 6 | 6 | 22 | A | 1 | 7.0 | M | U | 0.00 |
| 2 | 0 | 88003 | NaN | 5 | 12 | 3 | 5 | 15.00 | 15.00 | 11.25 | ... | 53 | 6 | 17 | 22 | S | 1 | 79.0 | F | U | 0.00 |
| 3 | 1 | 188721 | 20.00 | 1 | 11 | 0 | 3 | 20.00 | 20.00 | 12.45 | ... | 71 | 8 | 8 | 33 | A | 0 | 73.0 | F | U | 76293.00 |
| 4 | 1 | 88056 | 5.00 | 3 | 15 | 2 | 7 | 3.00 | 4.33 | 3.80 | ... | 63 | 6 | 12 | 24 | S | 1 | 68.0 | F | H | 113663.00 |
5 rows × 25 columns
# set the categorical data
# Potential_Customer and Status_Latest_Ad is binary (1,0) = thus it is categorical

categorical_cols = (["Potential_Customer", "Status_Cust", "Status_Latest_Ad", "Gender", "Cust_Prop"])

data[categorical_cols] = data[categorical_cols].astype("category")
numerical_cols = ['C_ID', 'Cust_Last_Purchase', 'Pur_3_years', 'Pur_5_years',
                  'Pur_3_years_Indirect', 'Pur_5_years_Indirect', 'Pur_latest',
                  'Pur_3_years_Avg', 'Pur_5_years_Avg', 'Pur_3_years_Avg_Indirect',
                  'InAct_Last', 'InAct_First', 'Ad_Res_1_year', 'Ad_Res_3_Year',
                  'Ad_Res_5_Year', 'Ad_Res_Ind_1_Year', 'Ad_Res_Ind_3_Year',
                  'Ad_Res_Ind_5_Year', 'Age', 'Cust_Ann_Income']

data[numerical_cols] = data[numerical_cols].astype("float64")
data.info()
<class 'pandas.core.frame.DataFrame'>
RangeIndex: 4469 entries, 0 to 4468
Data columns (total 25 columns):
 #   Column                    Non-Null Count  Dtype
---  ------                    --------------  -----
 0   Potential_Customer        4469 non-null   category
 1   C_ID                      4469 non-null   float64
 2   Cust_Last_Purchase        2149 non-null   float64
 3   Pur_3_years               4469 non-null   float64
 4   Pur_5_years               4469 non-null   float64
 5   Pur_3_years_Indirect      4469 non-null   float64
 6   Pur_5_years_Indirect      4469 non-null   float64
 7   Pur_latest                4469 non-null   float64
 8   Pur_3_years_Avg           4469 non-null   float64
 9   Pur_5_years_Avg           4469 non-null   float64
 10  Pur_3_years_Avg_Indirect  3642 non-null   float64
 11  InAct_Last                4469 non-null   float64
 12  InAct_First               4469 non-null   float64
 13  Ad_Res_1_year             4469 non-null   float64
 14  Ad_Res_3_Year             4469 non-null   float64
 15  Ad_Res_5_Year             4469 non-null   float64
 16  Ad_Res_Ind_1_Year         4469 non-null   float64
 17  Ad_Res_Ind_3_Year         4469 non-null   float64
 18  Ad_Res_Ind_5_Year         4469 non-null   float64
 19  Status_Cust               4469 non-null   category
 20  Status_Latest_Ad          4469 non-null   category
 21  Age                       3510 non-null   float64
 22  Gender                    4469 non-null   category
 23  Cust_Prop                 4469 non-null   category
 24  Cust_Ann_Income           4469 non-null   float64
dtypes: category(5), float64(20)
memory usage: 720.9 KB
Hint:
data.duplicated() will give you True if the row in data is duplicate and False otherwise.
duplicates.sum() will tell you how many duplicates you have in data.
data=data.drop_duplicates() will remove the duplicates
data.duplicated().sum()
851
data = data.drop_duplicates()
data.duplicated().sum()
0
# check dimension of the data after removing the duplicates

print('Dimensions of data:', data.shape)
Dimensions of data: (3618, 25)
data.head()
| Potential_Customer | C_ID | Cust_Last_Purchase | Pur_3_years | Pur_5_years | Pur_3_years_Indirect | Pur_5_years_Indirect | Pur_latest | Pur_3_years_Avg | Pur_5_years_Avg | ... | Ad_Res_5_Year | Ad_Res_Ind_1_Year | Ad_Res_Ind_3_Year | Ad_Res_Ind_5_Year | Status_Cust | Status_Latest_Ad | Age | Gender | Cust_Prop | Cust_Ann_Income | |
|---|---|---|---|---|---|---|---|---|---|---|---|---|---|---|---|---|---|---|---|---|---|
| 0 | 1 | 9946.0 | 5.0 | 2.0 | 17.0 | 2.0 | 4.0 | 0.0 | 7.50 | 7.76 | ... | 73.0 | 3.0 | 12.0 | 16.0 | A | 0 | 71.0 | F | H | 65957.0 |
| 1 | 1 | 87939.0 | 30.0 | 1.0 | 7.0 | 0.0 | 3.0 | 25.0 | 25.00 | 13.00 | ... | 55.0 | 6.0 | 6.0 | 22.0 | A | 1 | 7.0 | M | U | 0.0 |
| 2 | 0 | 88003.0 | NaN | 5.0 | 12.0 | 3.0 | 5.0 | 15.0 | 15.00 | 11.25 | ... | 53.0 | 6.0 | 17.0 | 22.0 | S | 1 | 79.0 | F | U | 0.0 |
| 3 | 1 | 188721.0 | 20.0 | 1.0 | 11.0 | 0.0 | 3.0 | 20.0 | 20.00 | 12.45 | ... | 71.0 | 8.0 | 8.0 | 33.0 | A | 0 | 73.0 | F | U | 76293.0 |
| 4 | 1 | 88056.0 | 5.0 | 3.0 | 15.0 | 2.0 | 7.0 | 3.0 | 4.33 | 3.80 | ... | 63.0 | 6.0 | 12.0 | 24.0 | S | 1 | 68.0 | F | H | 113663.0 |
5 rows × 25 columns
C_ID in our analysis? Drop the columns you will not use in your analysis, if there is any.¶Hint:
CatCols or NumCols
Example: CatCols.remove('C_ID')# we don't need customer id for our analysis,thus we will remove "C_ID"
# axis=1 argument indicates that we want to drop a column
data = data.drop('C_ID', axis=1)
# don't forget to remove also in our numerical_cols

numerical_cols.remove("C_ID")
# check

numerical_cols
['Cust_Last_Purchase',
 'Pur_3_years',
 'Pur_5_years',
 'Pur_3_years_Indirect',
 'Pur_5_years_Indirect',
 'Pur_latest',
 'Pur_3_years_Avg',
 'Pur_5_years_Avg',
 'Pur_3_years_Avg_Indirect',
 'InAct_Last',
 'InAct_First',
 'Ad_Res_1_year',
 'Ad_Res_3_Year',
 'Ad_Res_5_Year',
 'Ad_Res_Ind_1_Year',
 'Ad_Res_Ind_3_Year',
 'Ad_Res_Ind_5_Year',
 'Age',
 'Cust_Ann_Income']
Checking the relationship betweem variables, summary of data, outliers, filling missing values etc. If the ultimate goal is designing predictive models on the data, and we use EDA as part of the proprocessing, we are NOT allowed to do EDA on the test set. However, if you only do EDA to get business insight from the data, you CAN use the whole data, if you don't use that insight for data preprocessing such as data cleaning.
Example: To impute the missing values by mean/median, we calculate the mean or the median on the Train set only and then we impute the missing values by that mean/median on both Train and Test data.
Hint:
For visualization you can use sns.countplot() for each categorical variable
data.describe(include=("category"))
| Potential_Customer | Status_Cust | Status_Latest_Ad | Gender | Cust_Prop | |
|---|---|---|---|---|---|
| count | 3618 | 3618 | 3618 | 3618 | 3618 |
| unique | 2 | 6 | 2 | 3 | 2 |
| top | 0 | A | 1 | F | H |
| freq | 1882 | 2146 | 2057 | 1922 | 1981 |
# for own reference
# below code is given in PyDSTAT02_Distributions

import seaborn as sns

categorical_cols = ["Potential_Customer", "Status_Cust", "Status_Latest_Ad", "Gender", "Cust_Prop"]

catcols = pd.melt(data, value_vars=categorical_cols) # melt = wide format --> long

g = sns.FacetGrid(catcols, col="variable", sharex=False, sharey=False) # sharex sharey = False = axes x and y should not being shared across plots
g.map(sns.countplot, "value")
g.savefig("categorical.png", dpi=300)

from tabulate import tabulate

for x in categorical_cols:

    cat_prop = data[x].value_counts()
    cat_perc = (data[x].value_counts(normalize=True)*100).round(2)

    table = tabulate({"Category": cat_prop.index,

                      "Percentage": cat_perc},
                     headers=["Category", f"Count of {x}", f"Percentage of {x}"],
                     showindex=False, tablefmt="fancy_grid")

    print(f"{x}\n{table}\n")
Potential_Customer
╒════════════╤═══════════════════════════════╕
│   Category │   Count of Potential_Customer │
╞════════════╪═══════════════════════════════╡
│          0 │                         52.02 │
├────────────┼───────────────────────────────┤
│          1 │                         47.98 │
╘════════════╧═══════════════════════════════╛

Status_Cust
╒════════════╤════════════════════════╕
│ Category   │   Count of Status_Cust │
╞════════════╪════════════════════════╡
│ A          │                  59.31 │
├────────────┼────────────────────────┤
│ S          │                  26.64 │
├────────────┼────────────────────────┤
│ F          │                   6.05 │
├────────────┼────────────────────────┤
│ N          │                   5.72 │
├────────────┼────────────────────────┤
│ E          │                   1.99 │
├────────────┼────────────────────────┤
│ L          │                   0.28 │
╘════════════╧════════════════════════╛

Status_Latest_Ad
╒════════════╤═════════════════════════════╕
│   Category │   Count of Status_Latest_Ad │
╞════════════╪═════════════════════════════╡
│          1 │                       56.85 │
├────────────┼─────────────────────────────┤
│          0 │                       43.15 │
╘════════════╧═════════════════════════════╛

Gender
╒════════════╤═══════════════════╕
│ Category   │   Count of Gender │
╞════════════╪═══════════════════╡
│ F          │             53.12 │
├────────────┼───────────────────┤
│ M          │             42.29 │
├────────────┼───────────────────┤
│ U          │              4.59 │
╘════════════╧═══════════════════╛

Cust_Prop
╒════════════╤══════════════════════╕
│ Category   │   Count of Cust_Prop │
╞════════════╪══════════════════════╡
│ H          │                54.75 │
├────────────┼──────────────────────┤
│ U          │                45.25 │
╘════════════╧══════════════════════╛
import matplotlib.pyplot as plt

for x in categorical_cols:
    cat_prop = data[x].value_counts()
    cat_prop.plot(kind='pie', autopct='%1.1f%%', startangle=90, explode=[0.05]*len(cat_prop))
    plt.axis('equal')
    plt.title(x)
    plt.savefig(f"{x}.png")
    plt.show()


the data is imbalanced for Status_Cust
categorical_cols_imb = ["Status_Cust"]

catcols = pd.melt(data, value_vars=categorical_cols_imb)

g = sns.FacetGrid(catcols, col="variable", sharex=False, sharey=False)
g.map(sns.countplot, "value")
plt.show()

let's group the value to balance the data
new_value = {'A':'A',
             'S':'S',
             'E':'Others',
             'F':'Others',
             'N':'Others',
             'L':'Others'}

data['Status_Cust'] = data['Status_Cust'].replace(new_value)
data['Status_Cust'].unique()
['A', 'S', 'Others']
Categories (3, object): ['A', 'Others', 'S']
Hint:
Create list of the categorical features:
CatFes=list(set(CatCols)-set(['Potential_Customer']))
use sns.countplot() to create subplots for each categorical feature and hue=data.Potential_Customer to assign color to the plot based on the target variable Potential_Customer
import matplotlib.pyplot as plt
import seaborn as sns

fig, axs = plt.subplots(nrows=2, ncols=3, figsize=(15, 8))
sns.set(style='whitegrid')

for i, k in enumerate(categorical_cols):
    row, col = divmod(i, 3)
    ax = axs[row, col]
    sns.countplot(x=k,
                  hue='Potential_Customer',
                  data=data,
                  ax=ax)
    ax.set_title(k)

plt.tight_layout()

# Save the plot in one png
plt.savefig('categorical-target', dpi=300, bbox_inches='tight')

plt.show()

# status cust new has relationship with target variable
# status latest ad has relationship with target variable
Hint: use sns.distplot() and sns.boxplot()
# fig,ax = plt.subplots(nrows=len(numerical_cols), ncols=2, figsize=(20,60))

# for num in range (len(numerical_cols)):
#     sns.displot(data[numerical_cols[num]], ax=ax[num,0])
#     sns.boxplot(data[numerical_cols[num]], ax=ax[num,1])

# plt.tight_layout()
# plt.show()
# plt.subplots_adjust(wspace=0.4, hspace=0.4)
import matplotlib.pyplot as plt
import seaborn as sns

fig, axes = plt.subplots(nrows=4, ncols=5, figsize=(20,16))
axes = axes.ravel()

for i, k in enumerate(numerical_cols):
    sns.histplot(data=data, x=k, kde=True, ax=axes[i])
    axes[i].set_title(k)

plt.tight_layout()

# Save figure
plt.savefig('numerical_histograms.png')
plt.show()

import matplotlib.pyplot as plt
import seaborn as sns

fig, axes = plt.subplots(nrows=4, ncols=5, figsize=(25,16))
axes = axes.ravel()

for i, k in enumerate(numerical_cols):
    sns.boxplot(data=data, x=k, ax=axes[i])
    axes[i].set_title(k)

plt.tight_layout()

# Save figure
plt.savefig('numerical_boxplots.png')
plt.show()

# based on histplot with kde curve,we will check for skewness for further analysis in data imputation
# based on boxplot, majority of data has outliers,we will check for integrity of outliers for future analysis in data amputation
#
#
#
# our target variable is potential customer

fig, axes = plt.subplots(nrows=4, ncols=5, figsize=(20,16))
axes = axes.ravel()

for k, i in zip(numerical_cols, axes):
    sns.boxplot(data=data,
                x=k,
                y="Potential_Customer",
                hue="Potential_Customer",
                ax=i)
    i.set_title(k)

plt.tight_layout()
plt.show()

sns.boxplot(x=data["Potential_Customer"], y=data["Age"], data=data)
plt.show()

data.columns
Index(['Potential_Customer', 'Cust_Last_Purchase', 'Pur_3_years',
       'Pur_5_years', 'Pur_3_years_Indirect', 'Pur_5_years_Indirect',
       'Pur_latest', 'Pur_3_years_Avg', 'Pur_5_years_Avg',
       'Pur_3_years_Avg_Indirect', 'InAct_Last', 'InAct_First',
       'Ad_Res_1_year', 'Ad_Res_3_Year', 'Ad_Res_5_Year', 'Ad_Res_Ind_1_Year',
       'Ad_Res_Ind_3_Year', 'Ad_Res_Ind_5_Year', 'Status_Cust',
       'Status_Latest_Ad', 'Age', 'Gender', 'Cust_Prop', 'Cust_Ann_Income'],
      dtype='object')
import matplotlib.pyplot as plt
import seaborn as sns

fig, ax = plt.subplots(nrows=len(numerical_cols),ncols=1, figsize=(20,60))

for num in range(len(numerical_cols)):
    sns.boxplot(x=numerical_cols[num],y="Potential_Customer", data=data, ax=ax[num])

plt.tight_layout()
plt.subplots_adjust(wspace=0.4, hspace=0.4)

# Save figure
plt.savefig('numerical_boxplots_by_target.png')
plt.show()

Is there any significant difference between men/women's salary?
Is there any significant difference between men/women's number of the purchase in the last three years?
Is there any significant difference between men/women's average purchase in the last three years?
Is there any significant difference between men/women's total purchase in the last three years?
(optional) You can explore more about the relationships between the columns, if you believe the insight will improve some dicisions in this company. For instance, sending advertisements to customers regarding gender, customer status, etc.
data.columns
Index(['Potential_Customer', 'Cust_Last_Purchase', 'Pur_3_years',
       'Pur_5_years', 'Pur_3_years_Indirect', 'Pur_5_years_Indirect',
       'Pur_latest', 'Pur_3_years_Avg', 'Pur_5_years_Avg',
       'Pur_3_years_Avg_Indirect', 'InAct_Last', 'InAct_First',
       'Ad_Res_1_year', 'Ad_Res_3_Year', 'Ad_Res_5_Year', 'Ad_Res_Ind_1_Year',
       'Ad_Res_Ind_3_Year', 'Ad_Res_Ind_5_Year', 'Status_Cust',
       'Status_Latest_Ad', 'Age', 'Gender', 'Cust_Prop', 'Cust_Ann_Income'],
      dtype='object')
#1- Is there any significant difference between men/women's salary?

from scipy.stats import ttest_ind

# Split the data into two groups: men and women
men_salaries = data[data['Gender'] == 'M']['Cust_Ann_Income']
women_salaries = data[data['Gender'] == 'F']['Cust_Ann_Income']

# Calculate the p-value for the two-sample t-test
t_stat, p_value = ttest_ind(men_salaries, women_salaries)

# Print the results
print("p-value: ", p_value)
if p_value < 0.05:
    print('There is a significant difference between men and women\'s salaries.')
else:
    print('There is no significant difference between men and women\'s salaries.')
p-value:  0.002949686546935098
There is a significant difference between men and women's salaries.
#2- Is there any significant difference between men/women's number of purchases in the last three years?

# Split the data into two groups: men and women
men_purchases = data[data['Gender'] == 'M']['Pur_3_years']
women_purchases = data[data['Gender'] == 'F']['Pur_3_years']

# Calculate the p-value for the two-sample t-test
t_stat, p_value = ttest_ind(men_purchases, women_purchases)

# Print the results
print("p-value: ", p_value)
if p_value < 0.05:
    print('There is a significant difference between men and women\'s number of purchases in the last three years.')
else:
    print('There is no significant difference between men and women\'s number of purchases in the last three years.')
p-value:  0.05342107222541828
There is no significant difference between men and women's number of purchases in the last three years.
#3- Is there any significant difference between men/women's average purchase in the last three years?

# Split the data into two groups: men and women
men_avg_purchase = data[data['Gender'] == 'M']['Pur_3_years_Avg']
women_avg_purchase = data[data['Gender'] == 'F']['Pur_3_years_Avg']

# Calculate the p-value for the two-sample t-test
t_stat, p_value = ttest_ind(men_avg_purchase, women_avg_purchase)

# Print the results
print("p-value: ", p_value)
if p_value < 0.05:
    print('There is a significant difference between men and women\'s average purchase in the last three years.')
else:
    print('There is no significant difference between men and women\'s average purchase in the last three years.')
p-value:  0.02911965665430551
There is a significant difference between men and women's average purchase in the last three years.
men_avg_purchase_1 = data[data['Gender'] == 'M']['Pur_5_years_Avg']
men_avg_purchase_1.mean()
12.343333333333321
#4- Is there any significant difference between men/women's total purchase in the last three years?


data['Pur_3_years_avg_total'] = data['Pur_3_years_Avg'] * data['Pur_3_years']

# Split the data into two groups: men and women
men_total_purchase = data[data['Gender'] == 'M']['Pur_3_years_avg_total']
women_total_purchase = data[data['Gender'] == 'F']['Pur_3_years_avg_total']

# Calculate the p-value for the two-sample t-test
t_stat, p_value = ttest_ind(men_total_purchase, women_total_purchase)

# Print the results
print("p-value: ", p_value)
if p_value < 0.05:
    print('There is a significant difference between men and women\'s total purchase in the last three years.')
else:
    print('There is no significant difference between men and women\'s total purchase in the last three years.')
p-value:  0.33404528691822555
There is no significant difference between men and women's total purchase in the last three years.
#5- (optional) You can explore more about the relationships between the columns,
#   if you believe the insight will improve some dicisions in this company. For instance,
#   sending advertisements to customers regarding gender, customer status, etc.
data.head()
| Potential_Customer | Cust_Last_Purchase | Pur_3_years | Pur_5_years | Pur_3_years_Indirect | Pur_5_years_Indirect | Pur_latest | Pur_3_years_Avg | Pur_5_years_Avg | Pur_3_years_Avg_Indirect | ... | Ad_Res_Ind_1_Year | Ad_Res_Ind_3_Year | Ad_Res_Ind_5_Year | Status_Cust | Status_Latest_Ad | Age | Gender | Cust_Prop | Cust_Ann_Income | Pur_3_years_avg_total | |
|---|---|---|---|---|---|---|---|---|---|---|---|---|---|---|---|---|---|---|---|---|---|
| 0 | 1 | 5.0 | 2.0 | 17.0 | 2.0 | 4.0 | 0.0 | 7.50 | 7.76 | 7.50 | ... | 3.0 | 12.0 | 16.0 | A | 0 | 71.0 | F | H | 65957.0 | 15.00 |
| 1 | 1 | 30.0 | 1.0 | 7.0 | 0.0 | 3.0 | 25.0 | 25.00 | 13.00 | NaN | ... | 6.0 | 6.0 | 22.0 | A | 1 | 7.0 | M | U | 0.0 | 25.00 |
| 2 | 0 | NaN | 5.0 | 12.0 | 3.0 | 5.0 | 15.0 | 15.00 | 11.25 | 14.67 | ... | 6.0 | 17.0 | 22.0 | S | 1 | 79.0 | F | U | 0.0 | 75.00 |
| 3 | 1 | 20.0 | 1.0 | 11.0 | 0.0 | 3.0 | 20.0 | 20.00 | 12.45 | NaN | ... | 8.0 | 8.0 | 33.0 | A | 0 | 73.0 | F | U | 76293.0 | 20.00 |
| 4 | 1 | 5.0 | 3.0 | 15.0 | 2.0 | 7.0 | 3.0 | 4.33 | 3.80 | 4.00 | ... | 6.0 | 12.0 | 24.0 | S | 1 | 68.0 | F | H | 113663.0 | 12.99 |
5 rows × 25 columns
Sometimes we can use high level features that reflect the interactions between the columns as new features to get better insight and feed more information to our predictive models. Also transformation of some columns can be better options to be fed to the models. For instance, instead of a numerical column, you can use log of the column, square of the column, or any other transformation of the column. The type of interaction, or transformation you should choose, can be defined after Exploratory data analysis or just business insight.
Example: Instead of two variables for the number of purchase, and the average amount of purchase, we could calculate the total amount of purchase for the customers.
data.columns
Index(['Potential_Customer', 'Cust_Last_Purchase', 'Pur_3_years',
       'Pur_5_years', 'Pur_3_years_Indirect', 'Pur_5_years_Indirect',
       'Pur_latest', 'Pur_3_years_Avg', 'Pur_5_years_Avg',
       'Pur_3_years_Avg_Indirect', 'InAct_Last', 'InAct_First',
       'Ad_Res_1_year', 'Ad_Res_3_Year', 'Ad_Res_5_Year', 'Ad_Res_Ind_1_Year',
       'Ad_Res_Ind_3_Year', 'Ad_Res_Ind_5_Year', 'Status_Cust',
       'Status_Latest_Ad', 'Age', 'Gender', 'Cust_Prop', 'Cust_Ann_Income',
       'Pur_3_years_avg_total'],
      dtype='object')
# normalize data/dimension reduction = log()
data["Pur_3_years_Total"]=data["Pur_3_years"]*data["Pur_3_years_Avg"]
data["Pur_5_years_Total"]=data["Pur_5_years"]*data["Pur_5_years_Avg"]
data['Ad_Res_Rate_3_years'] = data["Pur_3_years"]/(data["Ad_Res_3_Year"]+data["Ad_Res_Ind_3_Year"]+1)


data["log_Pur_3_years_Indirect"]=np.log(data["Pur_3_years_Indirect"]+1)
data["log_Pur_latest"]=np.log(data["Pur_latest"]+1)
data["log_Pur_3_years"]=np.log(data["Pur_3_years"]+1)
data["log_Pur_3_years_Avg_Indirect"]=np.log(data["Pur_3_years_Avg_Indirect"]+1)
data["log_Pur_5_years_Indirect"]=np.log(data["Pur_5_years_Indirect"]+1)
data["log_Pur_3_years_Avg"]=np.log(data["Pur_3_years_Avg"]+1)
data["log_Pur_5_years"]=np.log(data["Pur_5_years"]+1)
data["log_Ad_Res_Rate_3_years"]=np.log(data["Ad_Res_Rate_3_years"]+1)
data["log_Pur_5_years_Total"]=np.log(data["Pur_5_years_Total"]+1)
data["log_Pur_3_years_Total"]=np.log(data["Pur_3_years_Total"]+1)


new_numerical_cols = ["log_Pur_3_years_Indirect","log_Pur_latest","log_Pur_3_years",
                      "log_Pur_3_years_Avg_Indirect", "log_Pur_5_years_Indirect",
                      "log_Pur_3_years_Avg", "log_Pur_5_years", "log_Ad_Res_Rate_3_years",
                      "log_Pur_5_years_Total", "log_Pur_3_years_Total","Pur_3_years_Total",
                      "Pur_5_years_Total"]

NewNumCols = new_numerical_cols + numerical_cols
data[new_numerical_cols+["Potential_Customer"]].groupby("Potential_Customer").median().T
| Potential_Customer | 0 | 1 |
|---|---|---|
| log_Pur_3_years_Indirect | 0.693147 | 1.098612 |
| log_Pur_latest | 2.772589 | 2.564949 |
| log_Pur_3_years | 1.386294 | 1.386294 |
| log_Pur_3_years_Avg_Indirect | 2.639057 | 2.420368 |
| log_Pur_5_years_Indirect | 1.609438 | 1.791759 |
| log_Pur_3_years_Avg | 2.729812 | 2.539237 |
| log_Pur_5_years | 2.197225 | 2.397895 |
| log_Ad_Res_Rate_3_years | 0.058841 | 0.068993 |
| log_Pur_5_years_Total | 4.394140 | 4.454347 |
| log_Pur_3_years_Total | 3.496508 | 3.555062 |
| Pur_3_years_Total | 32.000000 | 33.990000 |
| Pur_5_years_Total | 79.975000 | 85.000000 |
import matplotlib.pyplot as plt
import seaborn as sns

fig, ax = plt.subplots(nrows=len(new_numerical_cols), ncols=2, figsize=(12,50))

for i in range(len(new_numerical_cols)):
    sns.distplot(data[new_numerical_cols[i]], ax=ax[i,0])
    sns.boxplot(data[new_numerical_cols[i]], ax=ax[i,1])

plt.tight_layout()
plt.subplots_adjust(wspace=0.4, hspace=0.4)

# Save figure
plt.savefig('numerical_distribution_and_boxplots.png')
plt.show()

import matplotlib.pyplot as plt
import seaborn as sns

corr = data[new_numerical_cols]

plt.figure(figsize=(20, 15))
sns.heatmap(corr.corr(), cmap="coolwarm", annot=True, square=False)
plt.title('Correlation Heatmap')

# Save figure
plt.savefig('correlation_heatmap.png')
plt.show()

It is better we do not have numerical columns with high correlations as they confuse the machine learning algorithms. We can manually remove the highly-correlated features, or we can let the PCA handles that during the pre-processing.
Hint:
Check which columns have missing values
Create a list of the name of the columns that have missing values
null_columns=data.columns[data.isnull().any()]
Decide how you should handle the missing values for each column:
a. For some numerical columns missing value simply means 0. b. We can fill missing values in a numerical column by replacing mean of the column, if the column is not skewed. If the column is skewed, median might be a better option.
# 1-access the proportion of missing data

# print("Missing values distribution: ")
# print(round(data.isnull().mean() * 100, 2))  # round to 2 decimal places
# print("")
data.isnull().sum()
Potential_Customer                 0
Cust_Last_Purchase              1882
Pur_3_years                        0
Pur_5_years                        0
Pur_3_years_Indirect               0
Pur_5_years_Indirect               0
Pur_latest                         0
Pur_3_years_Avg                    0
Pur_5_years_Avg                    0
Pur_3_years_Avg_Indirect         662
InAct_Last                         0
InAct_First                        0
Ad_Res_1_year                      0
Ad_Res_3_Year                      0
Ad_Res_5_Year                      0
Ad_Res_Ind_1_Year                  0
Ad_Res_Ind_3_Year                  0
Ad_Res_Ind_5_Year                  0
Status_Cust                        0
Status_Latest_Ad                   0
Age                              793
Gender                             0
Cust_Prop                          0
Cust_Ann_Income                    0
Pur_3_years_avg_total              0
Pur_3_years_Total                  0
Pur_5_years_Total                  0
Ad_Res_Rate_3_years                0
log_Pur_3_years_Indirect           0
log_Pur_latest                     0
log_Pur_3_years                    0
log_Pur_3_years_Avg_Indirect     662
log_Pur_5_years_Indirect           0
log_Pur_3_years_Avg                0
log_Pur_5_years                    0
log_Ad_Res_Rate_3_years            0
log_Pur_5_years_Total              0
log_Pur_3_years_Total              0
dtype: int64
data['Cust_Last_Purchase'].fillna(0, inplace=True)

median = data['Pur_3_years_Avg_Indirect'].median()
data['Pur_3_years_Avg_Indirect'].fillna(median, inplace=True)

median = data['Age'].median()
data['Age'].fillna(median, inplace=True)

median = data['log_Pur_3_years_Avg_Indirect'].median()
data['log_Pur_3_years_Avg_Indirect'].fillna(median, inplace=True)
print('Missing values in data:', data.isnull().sum())
Missing values in data: Potential_Customer              0
Cust_Last_Purchase              0
Pur_3_years                     0
Pur_5_years                     0
Pur_3_years_Indirect            0
Pur_5_years_Indirect            0
Pur_latest                      0
Pur_3_years_Avg                 0
Pur_5_years_Avg                 0
Pur_3_years_Avg_Indirect        0
InAct_Last                      0
InAct_First                     0
Ad_Res_1_year                   0
Ad_Res_3_Year                   0
Ad_Res_5_Year                   0
Ad_Res_Ind_1_Year               0
Ad_Res_Ind_3_Year               0
Ad_Res_Ind_5_Year               0
Status_Cust                     0
Status_Latest_Ad                0
Age                             0
Gender                          0
Cust_Prop                       0
Cust_Ann_Income                 0
Pur_3_years_avg_total           0
Pur_3_years_Total               0
Pur_5_years_Total               0
Ad_Res_Rate_3_years             0
log_Pur_3_years_Indirect        0
log_Pur_latest                  0
log_Pur_3_years                 0
log_Pur_3_years_Avg_Indirect    0
log_Pur_5_years_Indirect        0
log_Pur_3_years_Avg             0
log_Pur_5_years                 0
log_Ad_Res_Rate_3_years         0
log_Pur_5_years_Total           0
log_Pur_3_years_Total           0
dtype: int64
Attention: Don't forget to exclude the column Cust_Last_Purchase from your analysis
X = data.drop(['Potential_Customer', "Cust_Last_Purchase"], axis = 1)
y = data["Potential_Customer"]

print("X shape:", X.shape, "y shape:", y.shape)
X shape: (3618, 36) y shape: (3618,)
#X = data.drop(['Potential_Customer'], axis = 1)
#y = data["Potential_Customer"]

#print("X shape:", X.shape, "y shape:", y.shape)
Now,let's Turned categorical variables into quantitative variable as most statistical models cannot take in the objects/strings as input
Categorical => Numeric
Solution:
# Remove Unknown gender as it bring no significance to our analysis

X['Gender'] = X['Gender'].replace('U', X['Gender'].mode()[0])
X["Gender"].unique()
['F', 'M']
Categories (2, object): ['F', 'M']
X = pd.get_dummies(X, drop_first=True)
X.head(1).T
| 0 | |
|---|---|
| Pur_3_years | 2.000000 |
| Pur_5_years | 17.000000 |
| Pur_3_years_Indirect | 2.000000 |
| Pur_5_years_Indirect | 4.000000 |
| Pur_latest | 0.000000 |
| Pur_3_years_Avg | 7.500000 |
| Pur_5_years_Avg | 7.760000 |
| Pur_3_years_Avg_Indirect | 7.500000 |
| InAct_Last | 14.000000 |
| InAct_First | 110.000000 |
| Ad_Res_1_year | 32.000000 |
| Ad_Res_3_Year | 48.000000 |
| Ad_Res_5_Year | 73.000000 |
| Ad_Res_Ind_1_Year | 3.000000 |
| Ad_Res_Ind_3_Year | 12.000000 |
| Ad_Res_Ind_5_Year | 16.000000 |
| Age | 71.000000 |
| Cust_Ann_Income | 65957.000000 |
| Pur_3_years_avg_total | 15.000000 |
| Pur_3_years_Total | 15.000000 |
| Pur_5_years_Total | 131.920000 |
| Ad_Res_Rate_3_years | 0.032787 |
| log_Pur_3_years_Indirect | 1.098612 |
| log_Pur_latest | 0.000000 |
| log_Pur_3_years | 1.098612 |
| log_Pur_3_years_Avg_Indirect | 2.140066 |
| log_Pur_5_years_Indirect | 1.609438 |
| log_Pur_3_years_Avg | 2.140066 |
| log_Pur_5_years | 2.890372 |
| log_Ad_Res_Rate_3_years | 0.032261 |
| log_Pur_5_years_Total | 4.889747 |
| log_Pur_3_years_Total | 2.772589 |
| Status_Cust_Others | 0.000000 |
| Status_Cust_S | 0.000000 |
| Status_Latest_Ad_1 | 0.000000 |
| Gender_M | 0.000000 |
| Cust_Prop_U | 0.000000 |
Define X and y and split the data into 75/25 train/test set. Use random_state=42 and stratify=y
X_train, X_test, y_train, y_test = train_test_split(X, y,
                                                    test_size=0.25,
                                                    random_state=42,
                                                    stratify=y)
Change categorical variables with numerical variabels
 X_train = pd.get_dummies(X_train, drop_first=True).reset_index(drop=True)
 X_test = pd.get_dummies(X_test, drop_first=True).reset_index(drop=True)
X.shape
(3618, 37)
from sklearn.preprocessing import StandardScaler

sc = StandardScaler()

X_train_scaled = sc.fit_transform(X_train)
X_test_scaled = sc.fit_transform(X_test)
X_train_scaled
array([[ 0.30892713,  1.90986605,  0.05513538, ...,  0.88063816,
        -0.85002334,  1.11451728],
       [ 0.76196459,  1.16549413,  1.27125164, ...,  0.88063816,
        -0.85002334, -0.89724944],
       [ 0.76196459, -0.32324971,  0.05513538, ..., -1.13554017,
         1.17643828, -0.89724944],
       ...,
       [-0.14411033,  1.05915528, -1.16098087, ...,  0.88063816,
         1.17643828, -0.89724944],
       [ 0.30892713, -0.32324971,  0.05513538, ..., -1.13554017,
        -0.85002334, -0.89724944],
       [-0.59714779,  1.05915528, -1.16098087, ...,  0.88063816,
        -0.85002334,  1.11451728]])
X_train_sc=pd.DataFrame(scaler.transform(X_train), columns=X_train.columns)
2. Separate train and test data for numerical columns only
train_PCA=X_train_sc[NewNumCols], test_PCA=X_test_sc[NewNumCols]
3. Define the number of components on train_PCA
4. Fit PCA on train_PCA
5. Transform train_PCA and test_PCA save it as PCA_train and PCA_test, and save them as DataFrame. Use PCA_train.index=X_train.index to make sure PCA_train have the same index with X_train because we need to concat this data to the dummy variables. Do the same on PCA_test
6. Concat PCA_train to the dummy variables in X_train save it as X_train_pca
7. Concat PCA_test to the dummy variables in X_test save it as X_train_pca
from sklearn.decomposition import PCA
categorical_cols
['Potential_Customer',
 'Status_Cust',
 'Status_Latest_Ad',
 'Gender',
 'Cust_Prop']
# Save the above scaled train and test data, as dataframe with proper
# column names X_train_sc=pd.DataFrame(scaler.transform(X_train), columns=X_train.columns)

X_train_sc=pd.DataFrame(X_train_scaled, columns=X_train.columns)
X_test_sc = pd.DataFrame(X_test_scaled, columns=X_test.columns)
categorical_cols
['Potential_Customer',
 'Status_Cust',
 'Status_Latest_Ad',
 'Gender',
 'Cust_Prop']
# assigned a variable for our new (dummy) cat data

NewCatCols = ['Status_Cust_Others', 'Status_Cust_S', 'Status_Latest_Ad_1', 'Gender_M', 'Cust_Prop_U']
NewNumColsPCA = list(set(X_train.columns)-set(NewCatCols))
len(NewNumColsPCA)
32
train_PCA = X_train_sc[NewNumColsPCA]
test_PCA = X_test_sc[NewNumColsPCA]
import matplotlib.pyplot as plt
from sklearn.decomposition import PCA

pca = PCA().fit(train_PCA)
plt.plot(np.cumsum(pca.explained_variance_ratio_))
plt.xlabel("No Of Comp")
plt.ylabel("Cumulative explained variance")
plt.savefig('pca_plot.png')
plt.show()

pca = PCA(n_components=20).fit(train_PCA)

PCA_train = pd.DataFrame(pca.transform(train_PCA))
PCA_train.index = X_train.index

PCA_test = pd.DataFrame(pca.transform(test_PCA))
PCA_test.index = X_test.index

X_train_pca = pd.concat([PCA_train, X_train[NewCatCols]], axis=1)
X_test_pca = pd.concat([PCA_test, X_test[NewCatCols]], axis=1)
X_train_pca.shape
(2713, 25)
X_test_pca.shape
(905, 25)
1. Design a predictive model to determine the potential customers who will purchase if you send the advertisement . The target variable is Potential_Customer.
**Attention:** Because the column `Cust_Last_Purchase` relates to the target variable `Potential_Customer`, you need to exclude it from your model.
Apply various ML algorithms on the data, evaluate them after Grid Search and Cross Validation, and choose the best model.
models = [
            ("Logistic Regression", LogisticRegression()),
            ("K-Nearest Neighbors", KNeighborsClassifier()),
            ("Decision Tree", DecisionTreeClassifier()),
            ("Support Vector Machine (RBF Kernel)", SVC()),
            ("Random Forest", RandomForestClassifier())       ]

Trained= {}

for t, model in models:
    Trained[t] = model.fit(X_train, y_train)
    print(f"{t} trained.")
Logistic Regression trained.
K-Nearest Neighbors trained.
Decision Tree trained.
Support Vector Machine (RBF Kernel) trained.
Random Forest trained.
# rujuk ML03b_CrossValidation_HyperParameterTuning_MC

param_grid = [

    ("Logistic Regression", {"C": [0.1, 10], "penalty": ["l1", "l2"]}),

    ("K-Nearest Neighbors", {"n_neighbors": [3, 5, 7]}),

    ("Decision Tree", {"max_depth": [3, 5, 7]}),

    ("Support Vector Machine (RBF Kernel)", {"C": [0.1, 1, 10], "gamma": ["scale", "auto"]}),

    ("Random Forest", {"n_estimators": [10, 50, 100], "max_depth": [3, 5, 7]})
]


best_models = {}

for t, model in Trained.items():
    grid = GridSearchCV(model, param_grid=dict(param_grid)[t], cv=5)
    grid.fit(X_train, y_train)
    best_models[t] = grid.best_estimator_
    print("Best Hyperparameters:", grid.best_params_)
    print(f"{t} trained.")
    print('***************************************************************')
Best Hyperparameters: {'C': 0.1, 'penalty': 'l2'}
Logistic Regression trained.
***************************************************************
Best Hyperparameters: {'n_neighbors': 3}
K-Nearest Neighbors trained.
***************************************************************
Best Hyperparameters: {'max_depth': 3}
Decision Tree trained.
***************************************************************
Best Hyperparameters: {'C': 1, 'gamma': 'auto'}
Support Vector Machine (RBF Kernel) trained.
***************************************************************
Best Hyperparameters: {'max_depth': 5, 'n_estimators': 100}
Random Forest trained.
***************************************************************
# print the models with its cross-validation score as %

for t, model in Trained.items():
    scores = cross_val_score(model, X.loc[:, X.columns != 'Cust_Last_Purchase'], y, cv=5)
    mean_score = scores.mean() * 100
    print(f"{t}: {mean_score:.2f}%")
Logistic Regression: 56.69%
K-Nearest Neighbors: 50.00%
Decision Tree: 51.22%
Support Vector Machine (RBF Kernel): 51.30%
Random Forest: 54.45%
# print the models with its cross-validation score as %
# and select the best model

scores = []
for t, model in Trained.items():
    mean_score = cross_val_score(model, X.loc[:, X.columns != 'Cust_Last_Purchase'], y, cv=5).mean() * 100
    scores.append(mean_score)
    print(f"{t}: {mean_score:.2f}%")

best_model_index = np.argmax(scores)    # np.argmax(scores) = return max value in scores
best_model_name = list(Trained.keys())[best_model_index]
print(f"\nThe best model is: {best_model_name}")
Logistic Regression: 56.69%
K-Nearest Neighbors: 50.00%
Decision Tree: 51.66%
Support Vector Machine (RBF Kernel): 51.30%
Random Forest: 54.17%

The best model is: Logistic Regression
X_train_pca.columns
Index([                   0,                    1,                    2,
                          3,                    4,                    5,
                          6,                    7,                    8,
                          9,                   10,                   11,
                         12,                   13,                   14,
                         15,                   16,                   17,
                         18,                   19, 'Status_Cust_Others',
            'Status_Cust_S', 'Status_Latest_Ad_1',           'Gender_M',
              'Cust_Prop_U'],
      dtype='object')
X_train_pca.columns = X_train_pca.columns.astype(str)
X_test_pca.columns = X_test_pca.columns.astype(str)

lr = LogisticRegression(C=0.1, penalty='l2', random_state=42)
lr.fit(X_train_pca, y_train)
y_pred = lr.predict(X_test_pca)
cm = confusion_matrix(y_test, y_pred)

sns.heatmap(cm, annot=True, fmt='.0f', cmap='Blues')
plt.title('Confusion matrix')
plt.xlabel('Predicted labels')
plt.ylabel('True labels')
plt.show()
plt.savefig('confusion_matrix.png')

confusion_matrix(y_test, y_pred)
array([[313, 158],
       [239, 195]], dtype=int64)
Finally, if we wish, we can use the best model and show the fit to our data using code from before:
from sklearn.metrics import confusion_matrix, accuracy_score, precision_score, recall_score,f1_score


print("Accuracy: ", round(accuracy_score(y_test, y_pred), 2))
print("Precision: ", round(precision_score(y_test, y_pred), 2))
print("Recall: ", round(recall_score(y_test, y_pred), 2))
print("F-score:", round(f1_score(y_test,y_pred), 2))
Accuracy:  0.56
Precision:  0.55
Recall:  0.45
F-score: 0.5
2. Calculate the value and the revenue of your model. Fit your model on train set. Assume amonge the customers on your test set we only send advertisement to those your model predicted as Class1 and we ignore the rest. From the data you can calculate the average Cust_Last_Purchase for those who are in the train set and had the last purchase (Cust_Last_Purchase>0) . Assume sending advertisement to each customer costs 5$ and the average purchase you calculated on the train set remains the same for the test set. Calculate the value of your models to choose the best model.
- cost = advertisement_cost * number of the predicted positive
- lost = average_purchase * number of the predicted negative but they have been positive
- gain = average_purchase * number of the predicted positive and they have been positive
- value = gain - lost - cost
- revenue = gain - cost
#Number_of_predicted_positives (PP) = TP + FP
#Number_of_predicted_negatives (PN) = TN + FN
#Number_of_actual_positives (AP) = TP + FN
#Number_of_actual_negatives (AN) = TN + FP

# confusion matrix lr

TP = 195
FP = 158
FN = 218
TN = 313

#1
cost = 5 * (TP+FP)
cost

# 2 -lost = average_purchase * number of the predicted negative but they have been positive
# Number of predicted positive but they have been negative (PL) = FN

average_cust_last_purchase = data[data['Cust_Last_Purchase'] > 0]['Cust_Last_Purchase'].mean()
lost = average_cust_last_purchase * FN
lost

# 3 - gain = average_purchase * number of the predicted positive and they have been positive

gain = average_cust_last_purchase * TP
gain

# 4- value = gain - lost - cost

value = gain - lost - cost
value

# 5- revenue = gain - cost

revenue = gain - cost
revenue

data_m = [
    ["Model Cost :", "$" + str(round(cost, 2))],
    ["Model Lost :", "$" + str(round(lost, 2))],
    ["Model Gain :", "$" + str(round(gain, 2))],
    ["Model Value :", "$" + str(round(value, 2))],
    ["Model Revenue :", "$" + str(round(revenue, 2))]
]

print(tabulate(data_m, headers=["Metric", "Value"], tablefmt="fancy_grid"))
╒═════════════════╤═══════════╕
│ Metric          │ Value     │
╞═════════════════╪═══════════╡
│ Model Cost :    │ $1765     │
├─────────────────┼───────────┤
│ Model Lost :    │ $3173.59  │
├─────────────────┼───────────┤
│ Model Gain :    │ $2838.76  │
├─────────────────┼───────────┤
│ Model Value :   │ $-2099.83 │
├─────────────────┼───────────┤
│ Model Revenue : │ $1073.76  │
╘═════════════════╧═══════════╛
data.columns
Index(['Potential_Customer', 'Cust_Last_Purchase', 'Pur_3_years',
       'Pur_5_years', 'Pur_3_years_Indirect', 'Pur_5_years_Indirect',
       'Pur_latest', 'Pur_3_years_Avg', 'Pur_5_years_Avg',
       'Pur_3_years_Avg_Indirect', 'InAct_Last', 'InAct_First',
       'Ad_Res_1_year', 'Ad_Res_3_Year', 'Ad_Res_5_Year', 'Ad_Res_Ind_1_Year',
       'Ad_Res_Ind_3_Year', 'Ad_Res_Ind_5_Year', 'Status_Cust',
       'Status_Latest_Ad', 'Age', 'Gender', 'Cust_Prop', 'Cust_Ann_Income',
       'Pur_3_years_avg_total', 'Pur_3_years_Total', 'Pur_5_years_Total',
       'Ad_Res_Rate_3_years', 'log_Pur_3_years_Indirect', 'log_Pur_latest',
       'log_Pur_3_years', 'log_Pur_3_years_Avg_Indirect',
       'log_Pur_5_years_Indirect', 'log_Pur_3_years_Avg', 'log_Pur_5_years',
       'log_Ad_Res_Rate_3_years', 'log_Pur_5_years_Total',
       'log_Pur_3_years_Total'],
      dtype='object')
Number of predicted positives (PP) = TP + FP Number of predicted negatives (PN) = TN + FN Number of actual positives (AP) = TP + FN Number of actual negatives (AN) = TN + FP
The model cost is the amount of money spent on sending advertisements to the customers predicted as Class1, which is calculated by multiplying the advertisement cost ($5) by the number of predicted Class1 customers (353).
The model lost is the amount of revenue lost due to not sending advertisements to the customers predicted as negative but actually were positive. This is calculated by multiplying the average purchase of the customers in the train set who had the last purchase (Cust_Last_Purchase>0) by the number of predicted negative customers (148) who were actually positive, which gives us a value of $3,479.3.
The model gain is the amount of revenue gained by sending advertisements to the customers predicted as Class1 and who actually made a purchase. This is calculated by multiplying the average purchase of the customers in the train set who had the last purchase (Cust_Last_Purchase>0) by the number of predicted positive customers (187) who actually made a purchase, which gives us a value of $2,838.76.
The model value is the difference between the gain, the lost, and the cost. A negative value implies that the cost and the lost outweigh the gain, and hence, the model is not profitable. In this case, the model value is -$2,405.54, which means that the cost and the lost are higher than the gain, and the model is not profitable.
The model revenue is the difference between the gain and the cost, which gives us a value of $1,073.76. This implies that the model generated revenue, but when considering the cost and the lost, it is still not profitable.
3. Compare your best models' revenue with the revenue of the default solution which is sending advertisement to all the customers in X_test. Which solution would you choose?
- cost = advertisement_cost * size of the test set
- gain = sum(Cust_Last_Purchase) on test set
- revenue = gain - cost
size_of_test = len(X_test)
size_of_test

# 1- cost = advertisement_cost * size of the test set

default_cost = 5 * size_of_test
default_cost

# 2- gain = sum(Cust_Last_Purchase) on test set
test_indices = X_test.index
default_gain = data.loc[test_indices, 'Cust_Last_Purchase'].sum()

default_gain

# 3- revenue = gain - cost

default_revenue = default_gain-default_cost
default_revenue

table_D = [["Default Solution Cost:", f"${round(default_cost, 2)}"],
         ["Default Solution Gain:", f"${round(default_gain, 2)}"],
         ["Default Solution Revenue:", f"${round(default_revenue, 2)}"]]

print(tabulate(table_D, headers=['Metric', 'Value'], tablefmt='fancy_grid'))
╒═══════════════════════════╤═════════╕
│ Metric                    │ Value   │
╞═══════════════════════════╪═════════╡
│ Default Solution Cost:    │ $4525   │
├───────────────────────────┼─────────┤
│ Default Solution Gain:    │ $6598.0 │
├───────────────────────────┼─────────┤
│ Default Solution Revenue: │ $2073.0 │
╘═══════════════════════════╧═════════╛
4. Assume the next time you want to target a group of 30,000 customers simillar to this group. And assume the purchase rate is $10%$ which means 10 out of 100 people who receive the advertisement will purchase the product. Also assume your model will have the same Precision and Recall for Class1 . Will you send the advertisement to everyone, or you use one of the models you have already created?
- calculate your model's revenue on this set of 30,000 customers based on the above assumptions
- calculate the revenue of the default model: send advertisement to everyone
     - cost = advertisement_cost * size of the test set
     - gain = average_purchase * purchase_rate
     - revenue = gain - cost
Hint: To calculate the revenue of a model for this new set of customers with different purchase rate we need to calculate the new confusion matrix given Precision and Recall for Class1 are fixed.
# model

size_target = 30000
pur_rate = 0.1

# Calculate new confusion matrix
TP = 195
FP = 158
FN = 239
TN = 313

# Calculate precision and recall
precision = TP / (TP + FP)
recall = TP / (TP + FN)

# Calculate the number of customers who will purchase the product
targeted_customers = size_target * pur_rate

# Calculate the number of customers who will not purchase the product
non_targeted_customers = size_target - targeted_customers

# Calculate the revenue from the targeted customers
revenue_targeted = targeted_customers * precision * average_cust_last_purchase

# Calculate the revenue from the non-targeted customers
revenue_non_targeted = non_targeted_customers * (1 - precision) * average_cust_last_purchase

# Calculate the total revenue of the model
revenue_model = revenue_targeted + revenue_non_targeted

revenue_model


# default

size_target = 30000
pur_rate = 0.1
advertisement_cost = 0.05

# Calculate the cost of sending advertisements to everyone
cost_default_model = size_target * advertisement_cost

# Calculate the gain from the customers who will purchase the product
gain_default_model = size_target * pur_rate * average_cust_last_purchase

# Calculate the revenue of the default model
revenue_default_model = gain_default_model - cost_default_model
revenue_default_model


from tabulate import tabulate

print("Revenue for target group of 30,000 :")
print()

data = [["Revenue", revenue_model, revenue_default_model ]]

col_names = ["Model", "Default"]

print(tabulate(data, headers=col_names, tablefmt="fancy_grid"))
Revenue for target group of 30,000 :

╒═════════╤═════════╤═══════════╕
│         │   Model │   Default │
╞═════════╪═════════╪═══════════╡
│ Revenue │  200056 │   42173.2 │
╘═════════╧═════════╧═══════════╛
The revenue for the optimized model is 200055.62, while the revenue for the default model is 42173.24. Therefore, the optimized model generates more revenue than the default model.